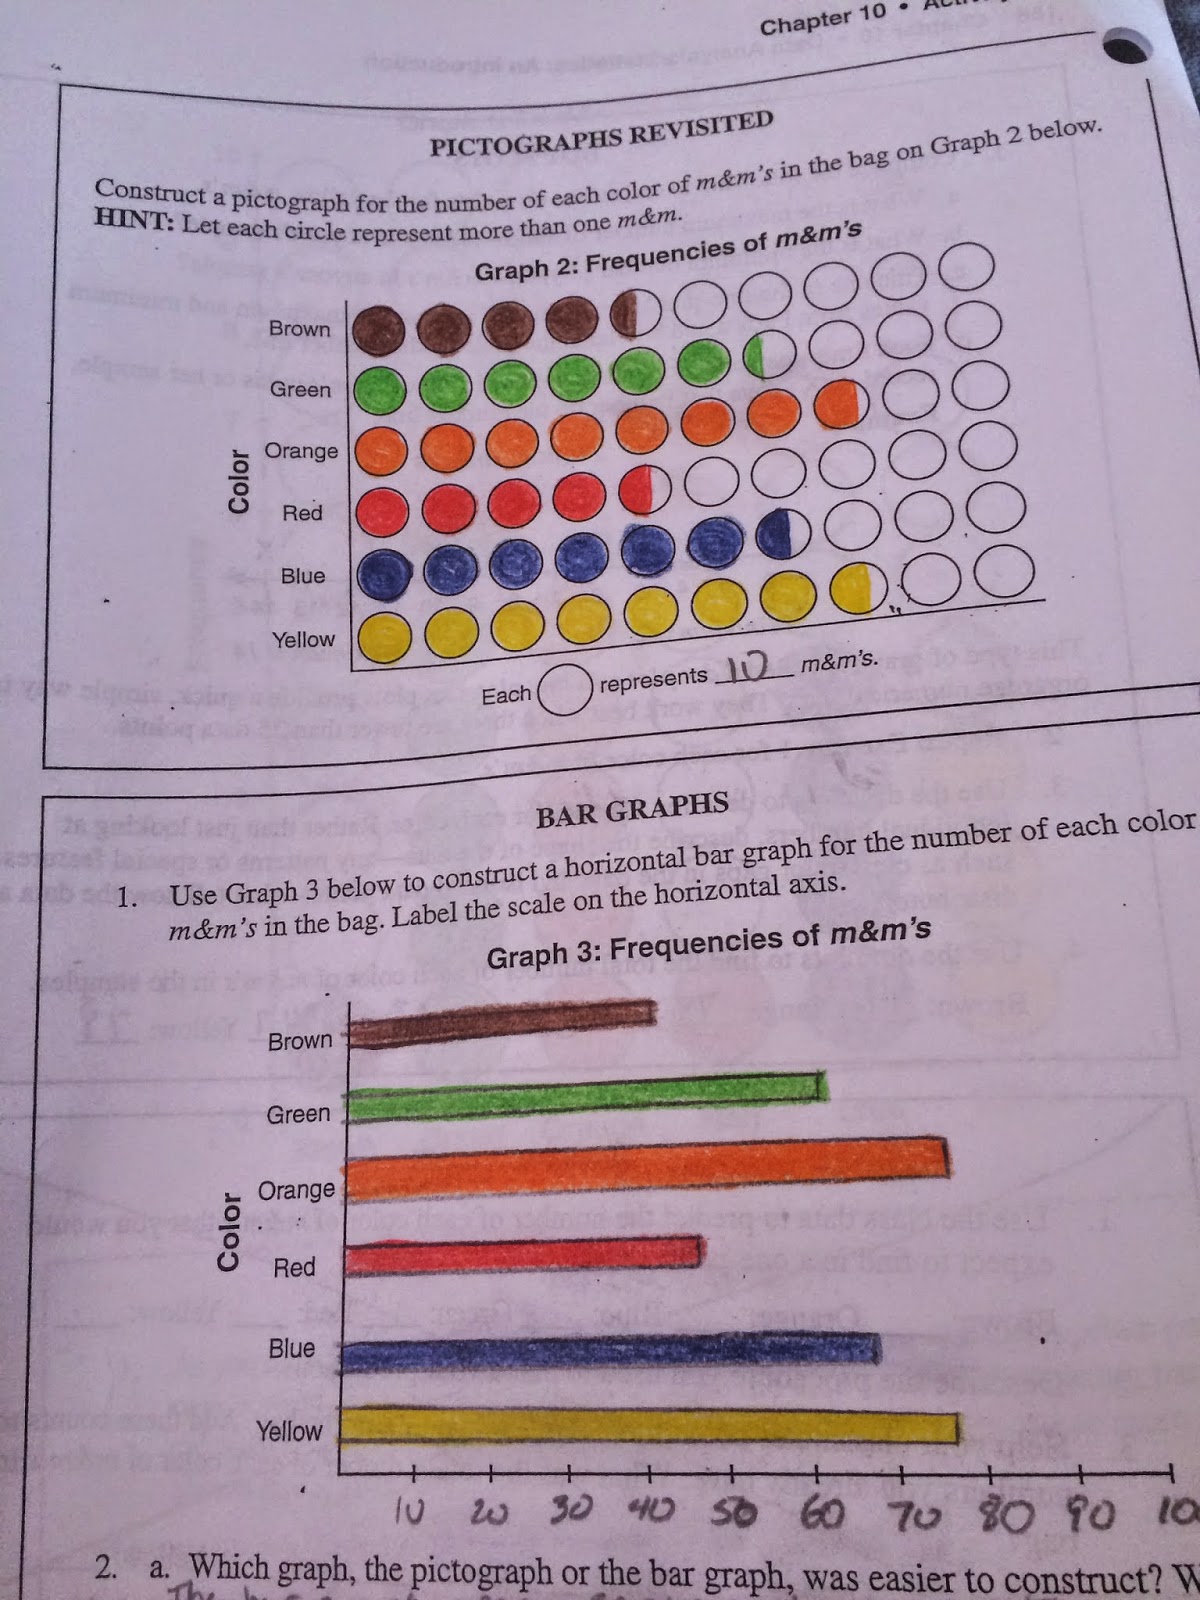
Then we started discussing what dot plots are and they are when you have a small set of data and you put each value on a specific point of a graph using an "x" or a dot. We created our own dot plots for the different colors of m&m's using the entire class data. after that was done we made another pictograph and bar graph based on the class data. We answered "what graph was easier to construct and why" and "what graph was easier to read and why". I answered saying the bar graph was easier to construct and read because make the bars more accurate and read it more accurately then the pictograph.


.JPG)
I really like this post! I liked how you explain what we did, but also left it up to a student to try on their own. Also, the pictures help the student to this at home. They can get m&ms, make the graph, and so fourth! You also have three types of graphs that they could figure out and find out what they are!
ReplyDelete